In 2020, we embarked on a mission to safeguard our organic crops from contamination. Conducting the first detailed “Contamination Report” for every threatened field was a first step. After analyzing the crops for an entire season, we identified the riskiest plots and excluded them from the certification process. To enhance our protective measures, we developed the “Risk Rating Plots” plan, considering essential criteria such as plot size and shape, the presence of neighboring conventional farms, neighbor’s crop type and positioning, actual plot size ratio, and the estimated threatened area expressed as a percentage of risk.
This approach led us to categorize the plots into various risk levels:
- No risk
- Low risk
- Medium risk
- High risk
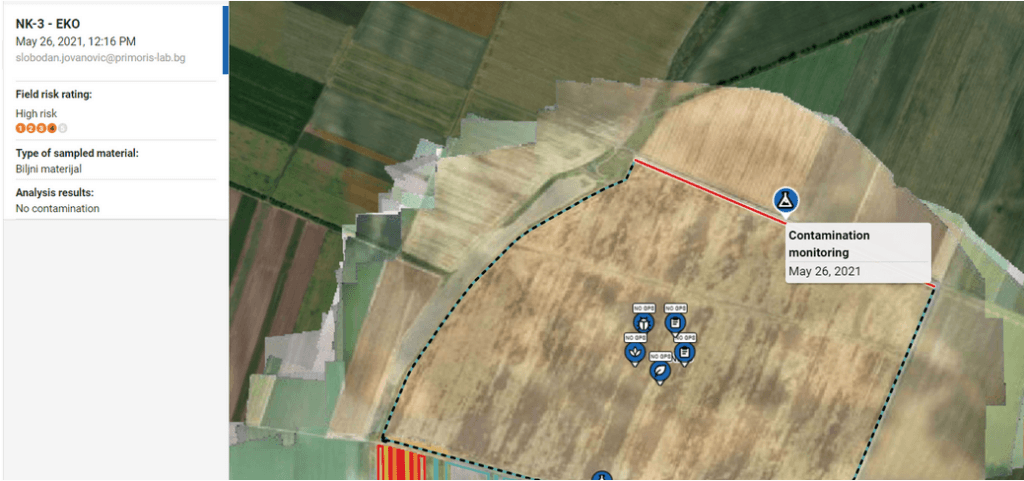
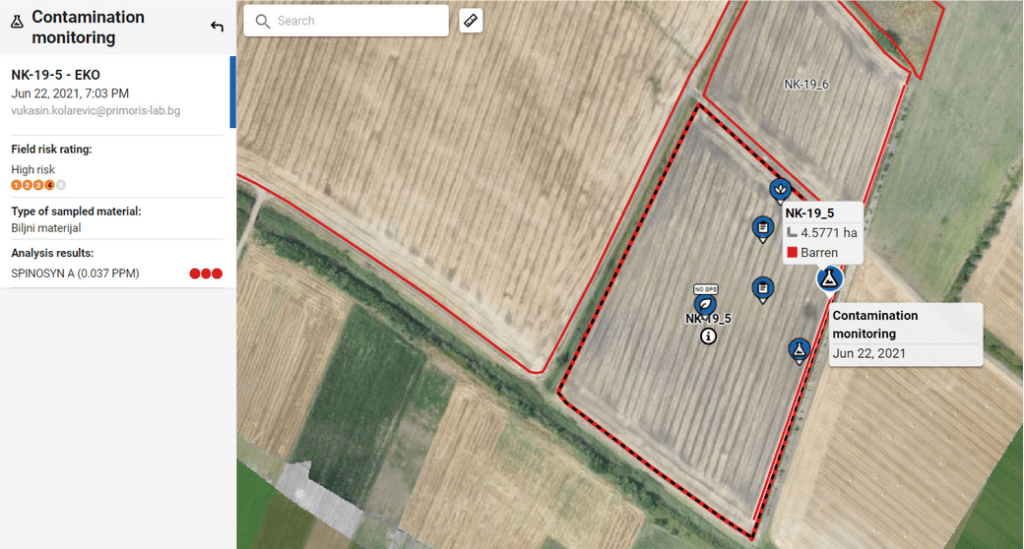
- Very high risk
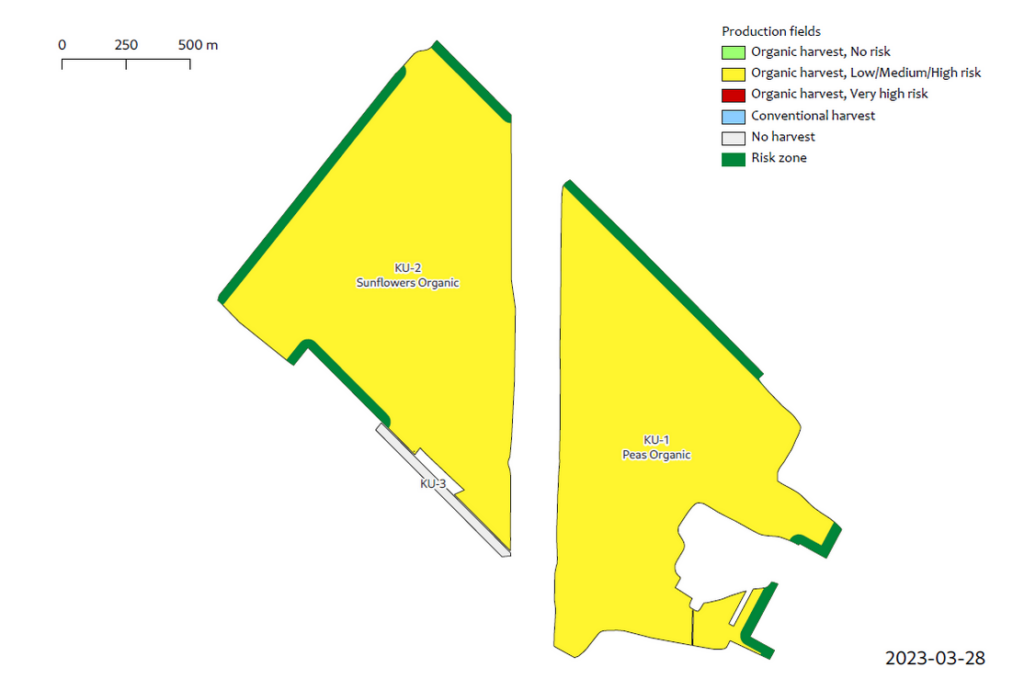
Plots with a score of Very high risk were typically small and isolated from the rest of the fields. As a proactive measure, we automatically declassified the crops harvested from these plots, meaning, although organically produced, we decided to sell them without an organic certificate (as so-called ‘conventional products’) on the market. This declassification is done by internal control of LoginEKO, to prevent contamination of our organic produce, and we believe this is the most responsible and fairest attitude towards the status in organic production one producer can have.
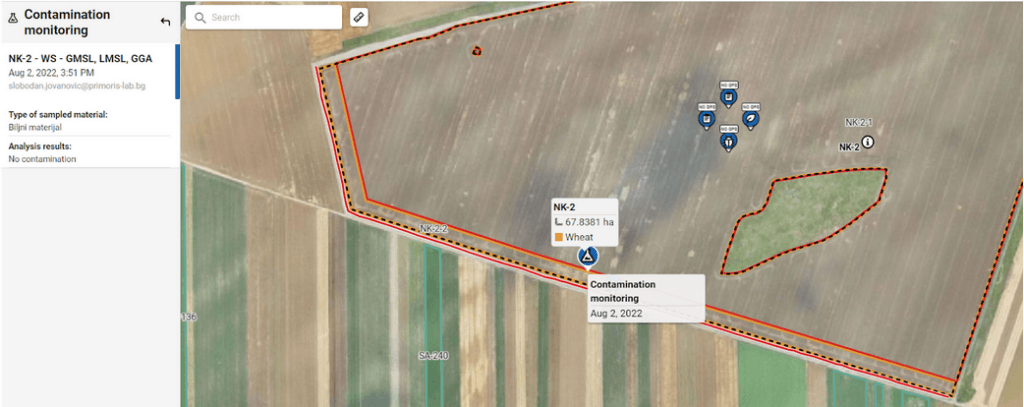
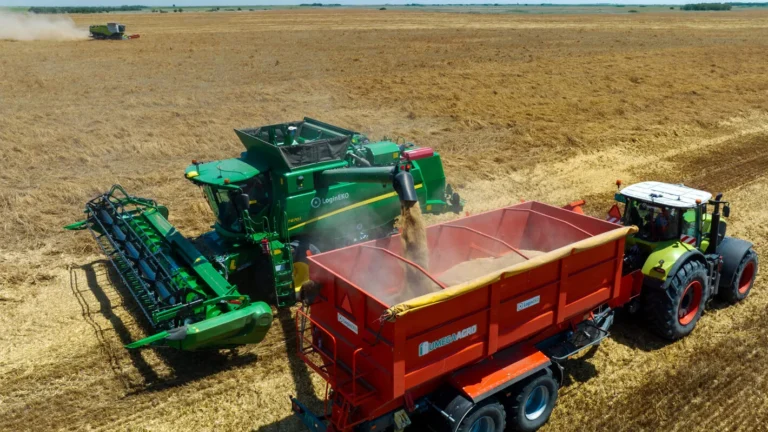
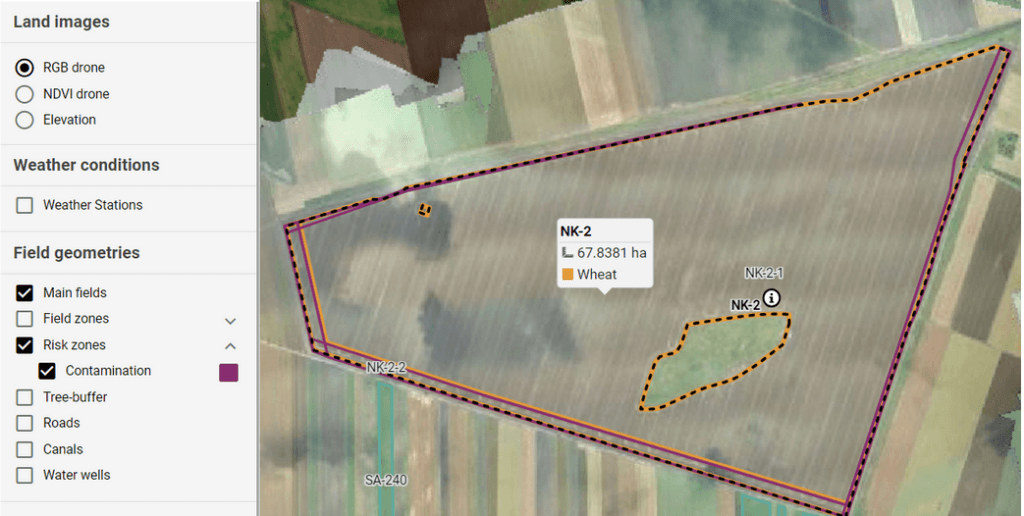
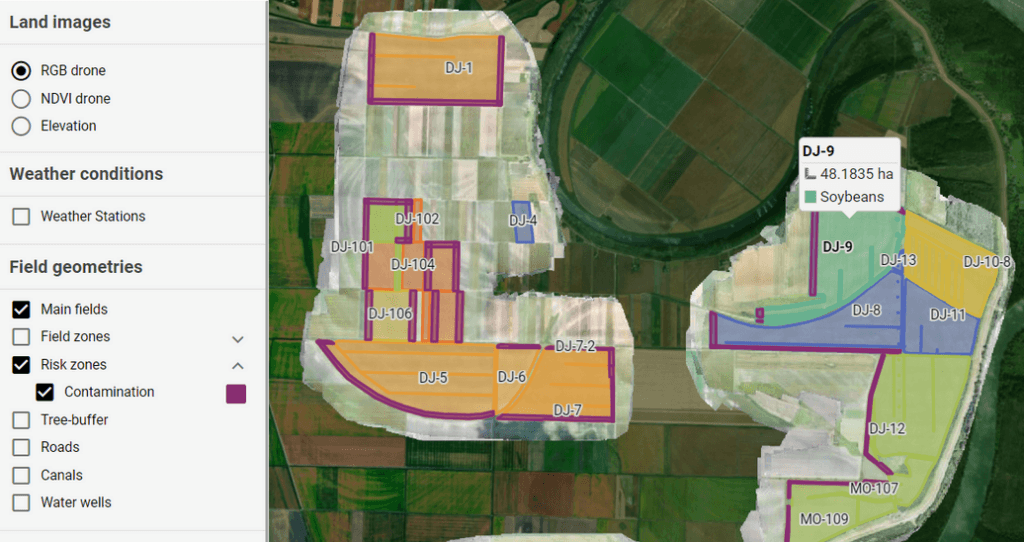
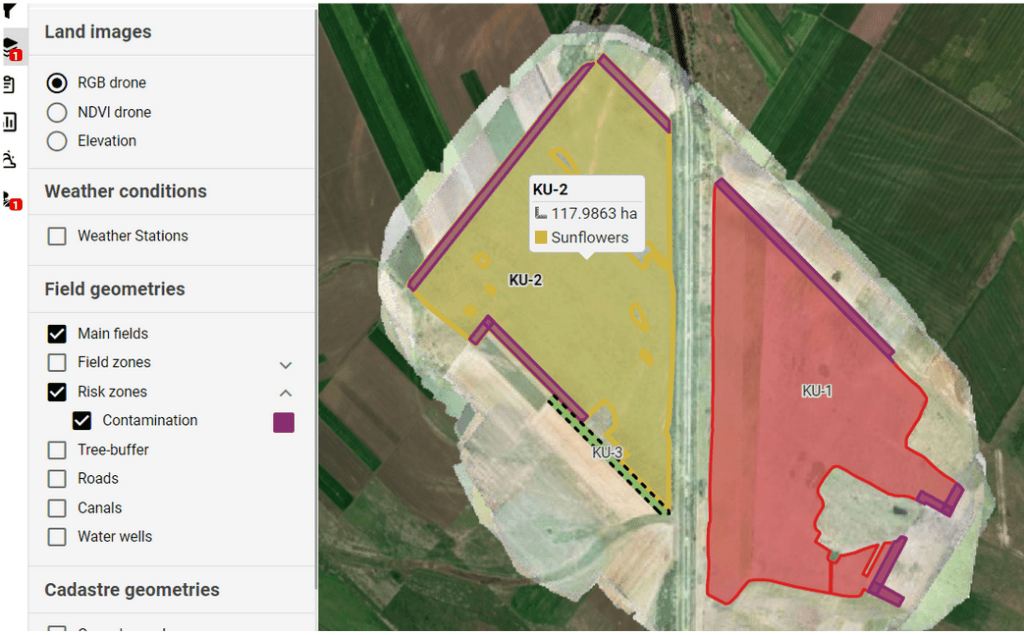
For plots with other risk scores, we established additional “Risk Zones” based on the presence and activities of neighboring fields. These Risk Zones encompassed areas within 40 meters of the neighbors’ cadaster edge. Prior to harvest, we mapped and imported these Risk Zones into our tractors and combine machines, ensuring a precise and focused approach during harvesting. This process effectively minimized the potential for cross-contamination and maintained the organic status of the crops within these zones.
To further bolster our contamination prevention efforts, we implemented a stringent sampling procedure using an accredited laboratory. Two weeks before harvest, plant material from the fields underwent pesticide screening for over 500 active ingredients. The results of these screenings played a crucial role in determining the subsequent steps:
- If an analysis showed positive residues in the plants, the risk zones were activated, and the contaminated crops were harvested separately. We followed strict separation and cleaning procedures before selling these crops directly from the fields or storing them separately from our organic produce.
- If there was no contamination, the entire crop was harvested as organic.
Based on the knowledge and lab analysis gathered thus far, we discovered that maintaining a distance of 40 meters from neighboring fields constituted the “safe side of contamination” for the final product.
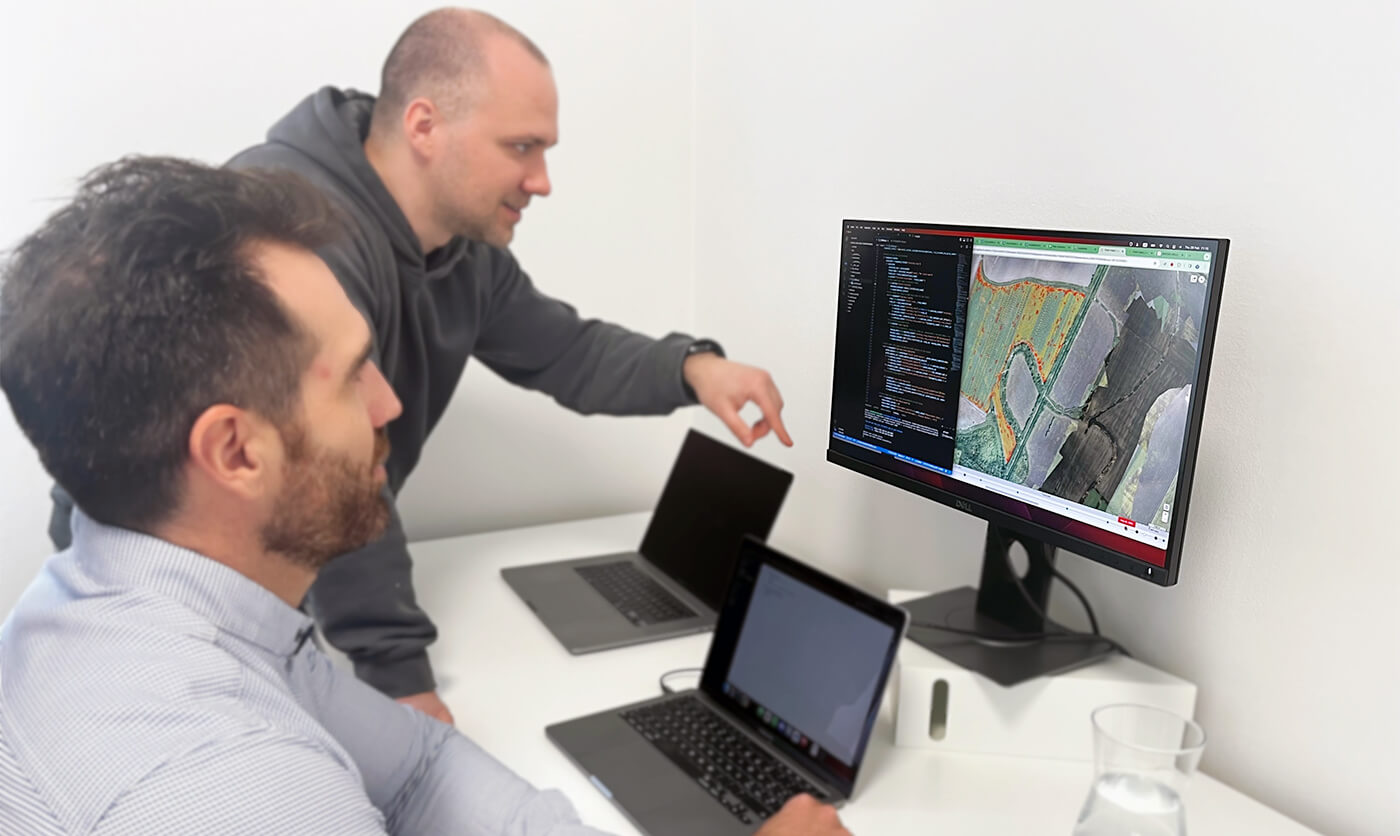
Looking ahead, we plan to consolidate all the experience, data, and weather parameters in our Farming Software by the end of this year. This comprehensive overview of the situation around the plots will serve as a valuable decision-making tool for farmers. It will guide them on how to respond based on plot conditions, the surrounding area, preserving crop status, and selecting appropriate organic standards.
Our dedication to protecting organic crops from contamination remains unwavering. As we continue to fine-tune this model, we will share our model once we are confident in its effectiveness. Stay tuned for updates on our progress in ensuring the integrity of organic farming practices.