How We Tackle Weeds in Organic Chickpeas
June 23, 2025We’re back in the field with our chickpea cultivation series! See how we tackle weeds after emergence using inter-row cultivation.
Read article
Does planning maintenance and improvement projects for your land give you a headache? Don’t worry. We’re developing a software solution much better than your usual painkiller.
LoginEKO is one of the few organizations tackling the challenges in our food system holistically from farm to table. Since this transformation is complex, we believe it can only be achieved by applying sophisticated data-based technology to every part of the food chain. That’s why our team of 40 engineers is working tirelessly to develop the ultimate farm management software. Something like a Swiss knife for farmers – one tool that does everything! We’re talking sustainable crop planning, centralized scheduling, tracking, warehousing, data acquisition through field scouting, and a map with both location and time information.

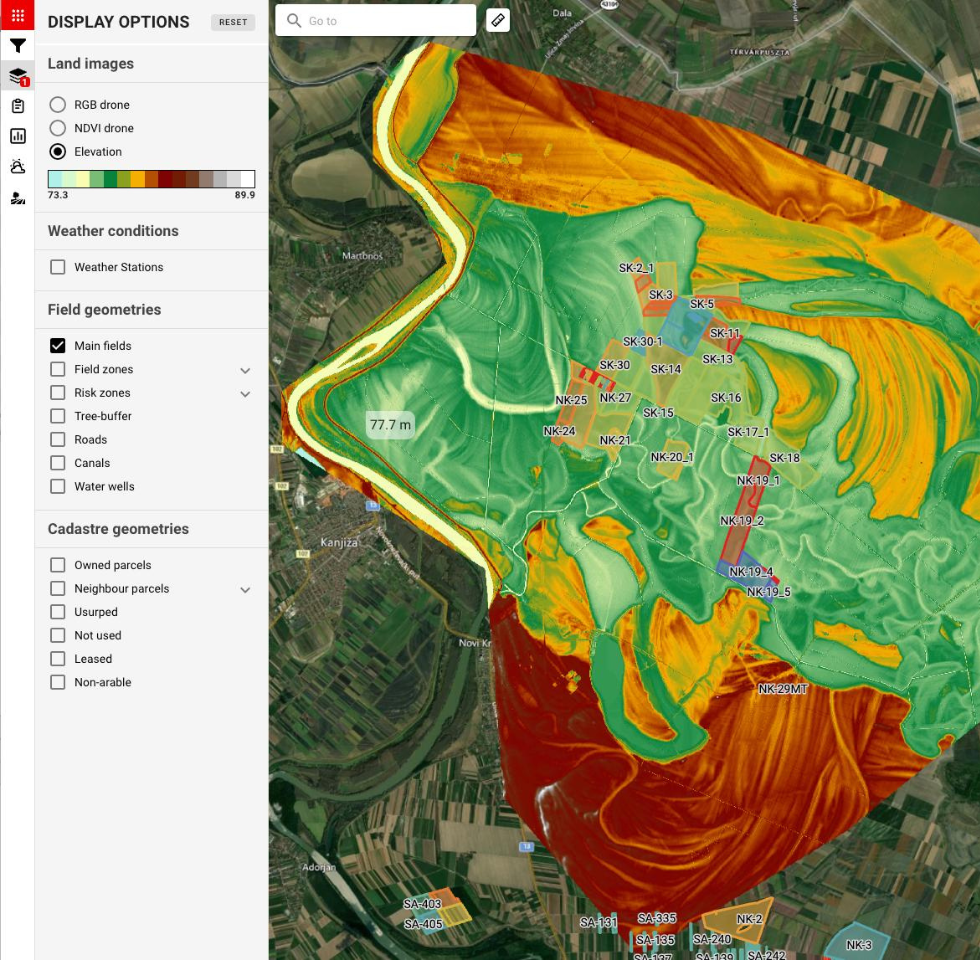
Our comprehensive farm management software starts with a farm fields map, which provides farmers with spatial and temporal views of all collected farm data. One of the most intriguing features is the “elevation map.” Let’s see what this means in farming and how it can help farmers with their work.
Elevation maps are a way of visualizing the altitude of the terrain in a specific area. They are created using various methods, such as satellite imagery, drone imaging, and GPS. The collected data is then processed and displayed in a way that represents the elevation of the land using contour lines, shading, and color coding.
LoginEKO’s elevation maps were created using drones equipped with LIDAR technology, which is the most important and interesting since it allows for a high level of accuracy with a resolution of around 3 centimeters. LIDAR is an active remote-sensing technology that uses lasers to measure how far away things are on the ground. When the laser pulses hit the ground and bounce back, the sensor records how long it takes for the laser to make the round trip. This time measurement helps us figure out the distance to the ground and creates detailed elevation maps so that we can detect even small objects like stones.
Related to color, we have a feature called “automatic scaling” that changes the color-coded map based on how close you zoom in, like in this example.
The color-coded elevation scale gets updated on every map change, so that the user can see more details as they zoom in. For example, you might have some high hills when zoomed out, so you couldn’t discern small height differences in the fields nearby. But when you move the map out from the hill, the map shows more details as it recalibrates to the new minimum and maximum levels of the map. This helps you get a better understanding of the land you’re looking at.
One of the greatest benefits of these high-resolution elevation maps is the ability to plan various maintenance and improvement projects for the land. For example, we can more easily plan renovations, the digging of new drains, and the straightening of fields to reduce water build-up, which ultimately leads to higher field yields, like in the example below.
Additionally, we can cultivate the fields more effectively using wider attachments, which require an even terrain to prevent deep or high dragging. We can also identify and remove any stones that could potentially damage our equipment. By using these maps, we can optimize the land’s use and productivity while minimizing any potential damages or setbacks.
The main advantage of our elevation maps is the visualization directly from our farming software, without the need for external tools or complex setups. This makes it incredibly easy and convenient to access and utilize the data. Furthermore, these elevation models can be compared with other visualizations, such as orthophotos. This enables us to visually confirm the location of objects like stones or caves, which can help us plan and execute maintenance and improvement projects more effectively. Additionally, we can compare the elevation maps with ndvi (normalized difference vegetation index) images to identify any areas with reduced chlorophyll levels in plants. This feature can indicate potential issues with nutrient levels or other environmental factors. This allows us to pinpoint specific locations and take corrective action as needed.
Visualizing the topography of their fields, allows farmers to make more informed decisions about their planting patterns and irrigation systems, ultimately leading to improved crop yields, reduced environmental impact, and increased profitability.
We understand that adopting sustainable practices can be a daunting task for farmers, which is why we are committed to creating software that is both sophisticated and user-friendly. By providing farmers with a comprehensive toolset, we aim to empower them to make informed decisions and optimize their operations for the long-term benefit of their businesses and the environment. The elevation map is just one example of the powerful tools we are developing, and we’re proud to announce that we plan on offering a viable solution for everybody to use for free. We will let you know when it is ready, so stay tuned.

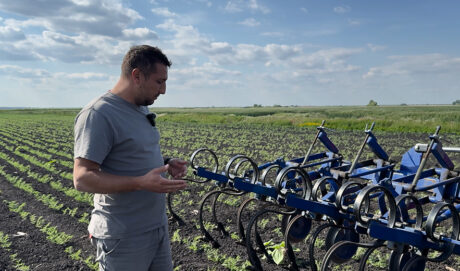
We’re back in the field with our chickpea cultivation series! See how we tackle weeds after emergence using inter-row cultivation.
Read article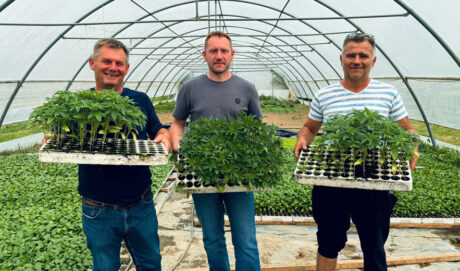
Two days, three farms, one shared goal: growing hemp more sustainably. Here’s what we learned and shared during our tour of Prekmurje.
Read article
Chickpeas offer great potential for organic farming. Join us as we walk you through the essential steps of chickpea cultivation, starting with seedbed preparation.
Read article